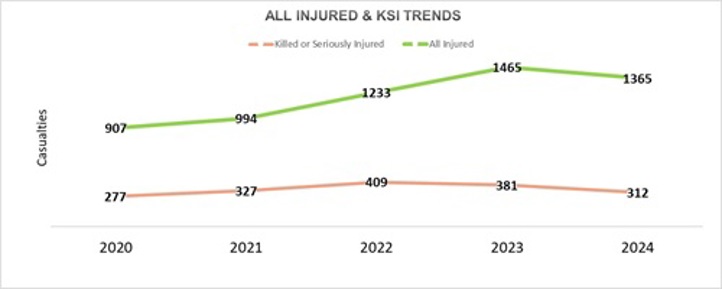
| Trend Statistics | 2020 | 2021 | 2022 | 2023 | 2024 |
|
Killed or Seriously Injured |
277 |
327 |
409 |
381 |
312 |
|
All Injured |
907 |
994 |
1233 |
1465 |
1365 |

Here you can access information about Gloucestershire’s casualty statistics. Below you will find information on casualty data, why we collect the data and what it is used for.
We have created a collection of tables and graphics below which illustrate all injury along with killed and seriously injured casualties on Gloucestershire roads.
Please note that the Gloucestershire casualty data comes from a live database, meaning that information may be updated if more details becomes available at a later date.
|
Casualty Severity |
2020-24 Average |
2024 |
% Difference |
|
Killed |
23 |
21 |
9% Decrease |
|
Serious |
318 |
291 |
8% Decrease |
|
Slight |
852 |
1053 |
24% Increase |
|
All Injured |
1193 |
1365 |
14% Increase |
| Trend Statistics | 2020 | 2021 | 2022 | 2023 | 2024 |
|
Killed or Seriously Injured |
277 |
327 |
409 |
381 |
312 |
|
All Injured |
907 |
994 |
1233 |
1465 |
1365 |
| Trend Statistics | 2020 | 2021 | 2022 | 2023 | 2024 |
|
Killed or Seriously Injured |
277 |
327 |
409 |
381 |
312 |
|
All Injured |
907 |
994 |
1233 |
1465 |
1365 |

| Casualty Severity | Percentage | 2020-24 Average |
|
Killed |
2% |
23 |
|
Serious |
27% |
318 |
|
Slight |
71% |
852 |
|
Total |
100% |
1193 |
| Casualty Severity | Percentage | 2020-24 Average |
|
Killed |
2% |
23 |
|
Serious |
27% |
318 |
|
Slight |
71% |
852 |
|
Total |
100% |
1193 |
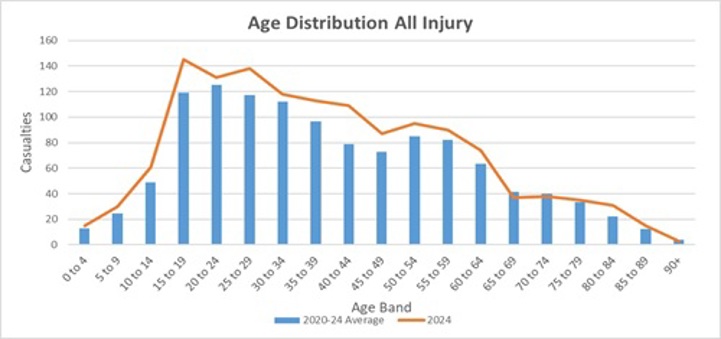
| Age Band | 2020-24 Average | 2024 |
|
0 to 4 |
13 |
15 |
|
5 to 9 |
25 |
30 |
|
10 to 14 |
49 |
61 |
|
15 to 19 |
119 |
145 |
|
20 to 24 |
125 |
131 |
|
25 to 29 |
117 |
138 |
|
30 to 34 |
112 |
118 |
|
35 to 39 |
97 |
113 |
|
40 to 44 |
79 |
109 |
|
45 to 49 |
73 |
87 |
|
50 to 54 |
85 |
95 |
|
55 to 59 |
82 |
90 |
|
60 to 64 |
63 |
74 |
|
65 to 69 |
41 |
37 |
|
70 to 74 |
40 |
38 |
|
75 to 79 |
34 |
35 |
|
80 to 84 |
22 |
31 |
|
85 to 89 |
13 |
15 |
|
90+ |
4 |
3 |
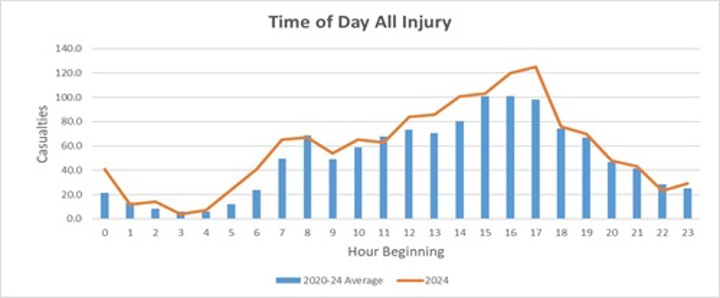
| Hour Beginning | 2020-24 Average | 2024 |
|
0 |
22 |
41 |
|
1 |
14 |
12 |
|
2 |
8 |
14 |
|
3 |
6 |
4 |
|
4 |
6 |
7 |
|
5 |
12 |
24 |
|
6 |
24 |
41 |
|
7 |
49 |
65 |
|
8 |
69 |
67 |
|
9 |
49 |
54 |
|
10 |
59 |
65 |
|
11 |
68 |
63 |
|
12 |
73 |
84 |
|
13 |
71 |
86 |
|
14 |
81 |
101 |
|
15 |
101 |
103 |
|
16 |
101 |
120 |
|
17 |
98 |
125 |
|
18 |
74 |
76 |
|
19 |
67 |
70 |
|
20 |
47 |
48 |
|
21 |
42 |
43 |
|
22 |
29 |
23 |
|
23 |
25 |
29 |
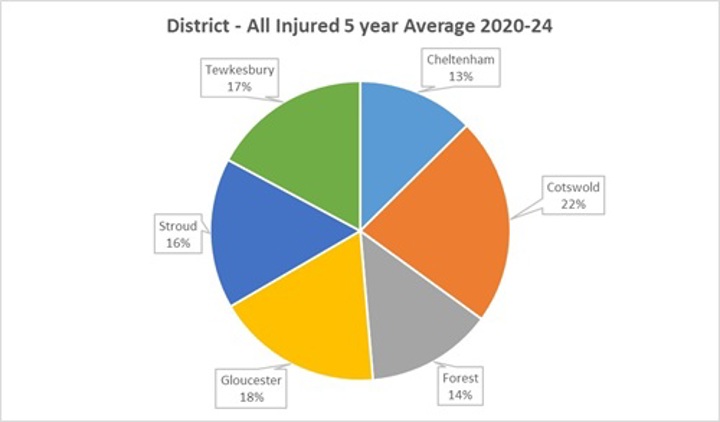
| Districts 2020-24 Total | Killed | Serious | Slight | Total |
All Injury 2020-24 Average |
Percentage |
| Cheltenham |
7 |
195 |
548 |
750 |
150 |
13% |
| Cotswold |
47 |
398 |
894 |
1339 |
268 |
22% |
| Forest |
16 |
221 |
576 |
813 |
163 |
14% |
| Gloucester |
10 |
252 |
808 |
1070 |
214 |
18% |
| Stroud |
13 |
265 |
693 |
971 |
194 |
16% |
| Tewkesbury |
23 |
260 |
739 |
1022 |
204 |
17% |
| Total |
116 |
1591 |
4258 |
5965 |
1193 |
100% |
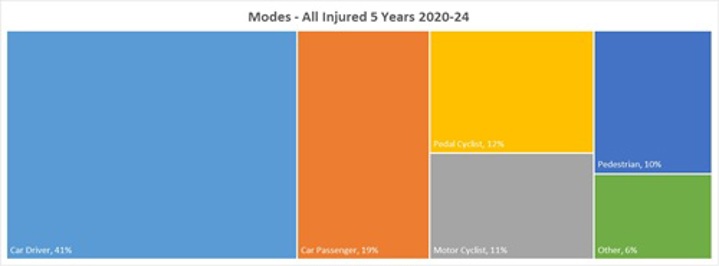
| Modes 2020-24 Total | Killed | Serious | Slight | Total | All Injured 2020-24 Average | Percentage |
| Car Driver |
42 |
504 |
1911 |
2457 |
41% |
491 |
| Car Passenger |
18 |
260 |
844 |
1122 |
19% |
224 |
| Motor Cyclist |
25 |
304 |
316 |
645 |
11% |
129 |
| Pedal Cyclist |
6 |
231 |
506 |
743 |
12% |
149 |
| Pedestrian |
18 |
202 |
405 |
625 |
10% |
125 |
| Other |
7 |
90 |
276 |
373 |
6% |
75 |
| Total |
116 |
1591 |
4258 |
5965 |
100% |
1193 |
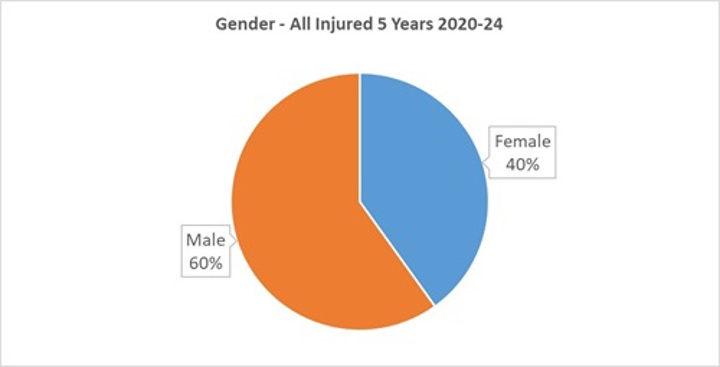
| All Injured | 2020-24 Average | Percentage |
|
Female |
478 |
40% |
|
Male |
715 |
60% |
| All Injured | 2020-24 Average | Percentage |
|
Female |
478 |
40% |
|
Male |
715 |
60% |
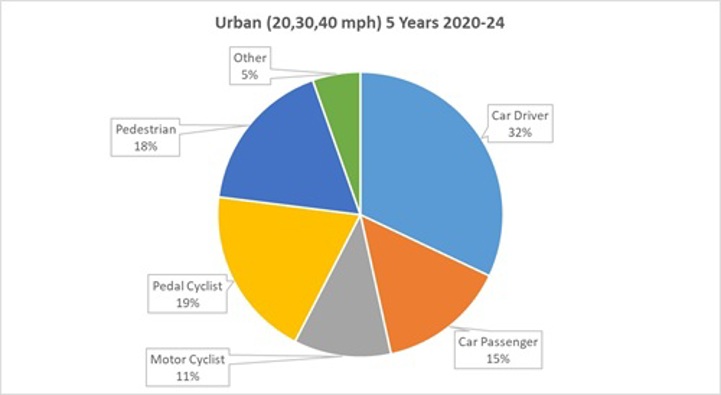
| 2020-24 Total | Urban (20,30,40 mph) | Percentage |
|
Car Driver |
1042 |
32% |
|
Car Passenger |
471 |
15% |
|
Motor Cyclist |
358 |
11% |
|
Pedal Cyclist |
631 |
19% |
|
Pedestrian |
572 |
18% |
|
Other |
176 |
5% |
| 2020-24 Total | Urban (20,30,40 mph) | Percentage |
|
Car Driver |
1042 |
32% |
|
Car Passenger |
471 |
15% |
|
Motor Cyclist |
358 |
11% |
|
Pedal Cyclist |
631 |
19% |
|
Pedestrian |
572 |
18% |
|
Other |
176 |
5% |
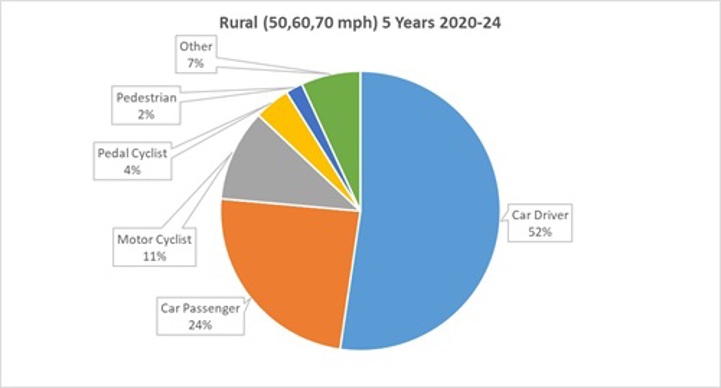
| 2020-24 Total | Rural (50,60,70 mph) | Percentage |
|
Car Driver |
1415 |
52% |
|
Car Passenger |
651 |
24% |
|
Motor Cyclist |
287 |
11% |
|
Pedal Cyclist |
112 |
4% |
|
Pedestrian |
53 |
2% |
|
Other |
186 |
7% |
| 2020-24 Total | Rural (50,60,70 mph) | Percentage |
|
Car Driver |
1415 |
52% |
|
Car Passenger |
651 |
24% |
|
Motor Cyclist |
287 |
11% |
|
Pedal Cyclist |
112 |
4% |
|
Pedestrian |
53 |
2% |
|
Other |
186 |
7% |
| Speed Limit 2020-24 Total | 20 mph | 30 mph | 40 mph | 50 mph | 60 mph | 70 mph | Total |
|
Car Driver |
41 |
635 |
366 |
350 |
894 |
171 |
2457 |
|
Car Passenger |
12 |
294 |
165 |
165 |
394 |
92 |
1122 |
|
Motor Cyclist |
24 |
245 |
89 |
103 |
165 |
19 |
645 |
|
Pedal Cyclist |
49 |
462 |
120 |
35 |
75 |
2 |
743 |
|
Pedestrian |
84 |
442 |
46 |
17 |
29 |
7 |
625 |
|
Other |
12 |
116 |
48 |
44 |
99 |
54 |
373 |
|
Total |
222 |
2194 |
834 |
714 |
1656 |
345 |
5965 |
|
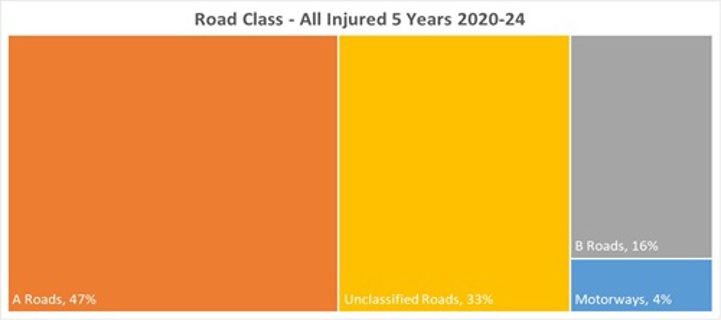
All Injuries 2020-24 Total |
Total | Percentage |
|
Motorways |
233 |
4% |
|
A Roads |
2800 |
47% |
|
B Roads |
973 |
16% |
|
Unclassified Roads |
1959 |
33% |
|
Total |
5965 |
100% |
|
All Injuries 2020-24 Total |
Total | Percentage |
|
Motorways |
233 |
4% |
|
A Roads |
2800 |
47% |
|
B Roads |
973 |
16% |
|
Unclassified Roads |
1959 |
33% |
|
Total |
5965 |
100% |
Every year on Gloucestershire’s roads, there are around 1000 personal injury road traffic collisions, resulting in a larger number of casualties.
The Road Safety Team maintains a database of statistics on all personal injury road collisions records within the county. Gloucestershire Constabulary provides this information to us and each report is carefully checked for accuracy. Details like road type, road number and grid reference are especially important to us.
The council has access to collisions dating back to 1983 - over 100,000 records, which can be used together with our computer mapping system to monitor risk, accident clusters and concentrations on the highway network. This enables us to prioritise our annual programme and target our spending on road improvements.
Gloucestershire Constabulary also send this data to the Department for Transport to assist with the compilation of national road casualty statistics.
In addition to identifying collisions clusters and “hotspots”, the database can also be used to:
In addition to identifying collisions clusters and “hotspots”, the database can also be used to:
Please note that Gloucestershire Constabulary changed their method of reporting injury collisions in 2015 and as a result there has been an increase in the number of serious casualties in Gloucestershire.
The Department of Transport is investigating nationally the effect of this change. Until the results of the investigation is known the reporting of all killed and serious injury (KSI) figures should be viewed with caution.